Paper review 4
Representation and Reinforcement Learning for Personalized Glycemic Control in Septic Patients, NIPS workshop (ML4H) (2017) [Paper]
Summary
- Using policy iteration, find the optimal target of glucose level.
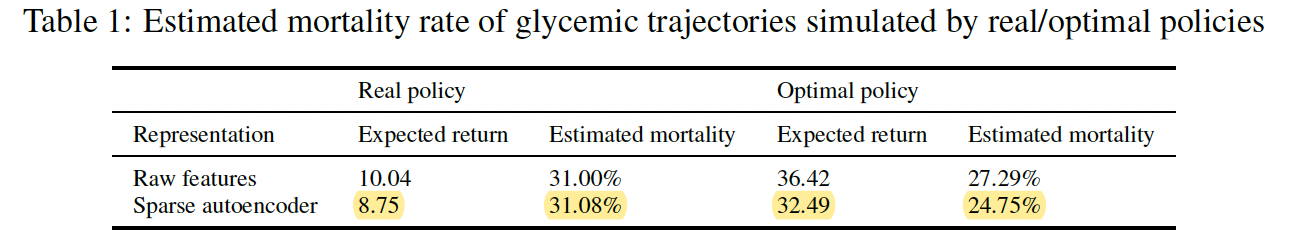
- By evaluation of $\pi^r$ and $\pi^*$, it showed the optimal policy reduced 90-day mortality rate by 6.3%
This paper is written unclearly, and the way of evaluation is suspicious, especially how to generate the estimated mortality–expected return function and how to compute mean expected return from testing set or simulated trajectories.
Introduction
Study goal
To help clinicians better address the challenge of managing patients’ glucose levels, we need a personalized glycemic control strategy that can take into account variations in patients’ physiological and pathological states, such as their degree of insulin dependence and tolerance.
The goal of decision support for glycemic control is to target specific ranges of serum glucose that optimize outcomes for patients.
Study design
In their approach, they do not try to recommend specific interventions such as insulin oral hypoglycemic agent administration to achieve the target goals, but focus on finding the optimal targets.
Thus, the “action” in our formulation is interpreted as choosing the best glycemic target under the circumstances, leaving the choice of agents and doses to achieve that target to the clinicians.
This simplification avoids the need to model the variability of patients’ glycemic responses to actual insulin doses and avoids data problems with incorrectly recorded dose timing.
Method
Patient state representation and clustering
Step 1. raw feature representation or latent representation by sparse autoencoder with d=32
Step 2. k-means clustering algorithm with k=500 to generate state representation
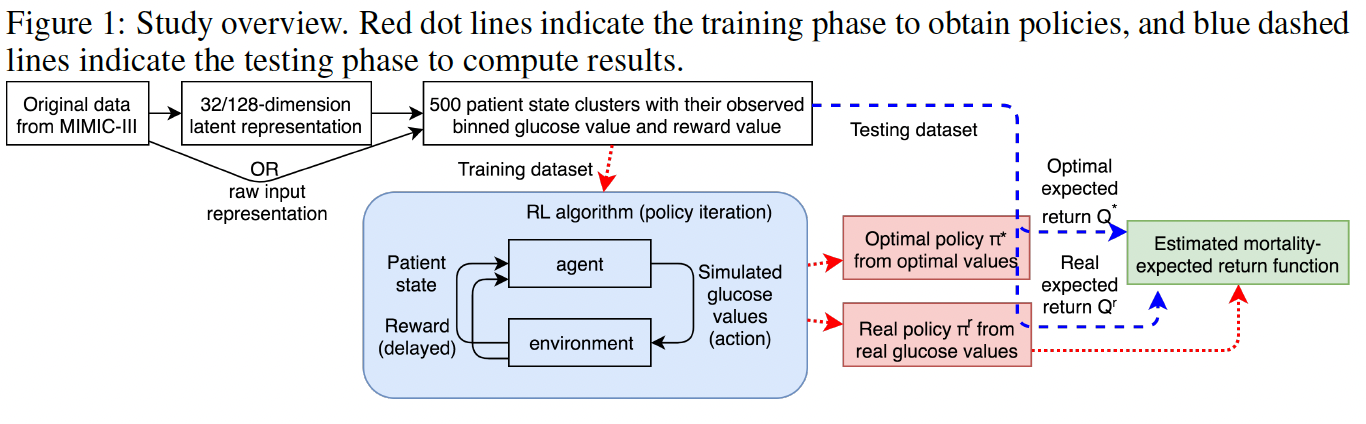
Reinforcement learning and evaluation
Policy interation algorithm -> obtain $\pi^*$ and $Q^*$
$\pi^r$ is adopted from real trajectories, only the one with the highest probability in P (?.. I think it is adopted by most frequently selected action)
$\pi^r$ and real mortality rate -> Estimated mortality–expected return function (???)
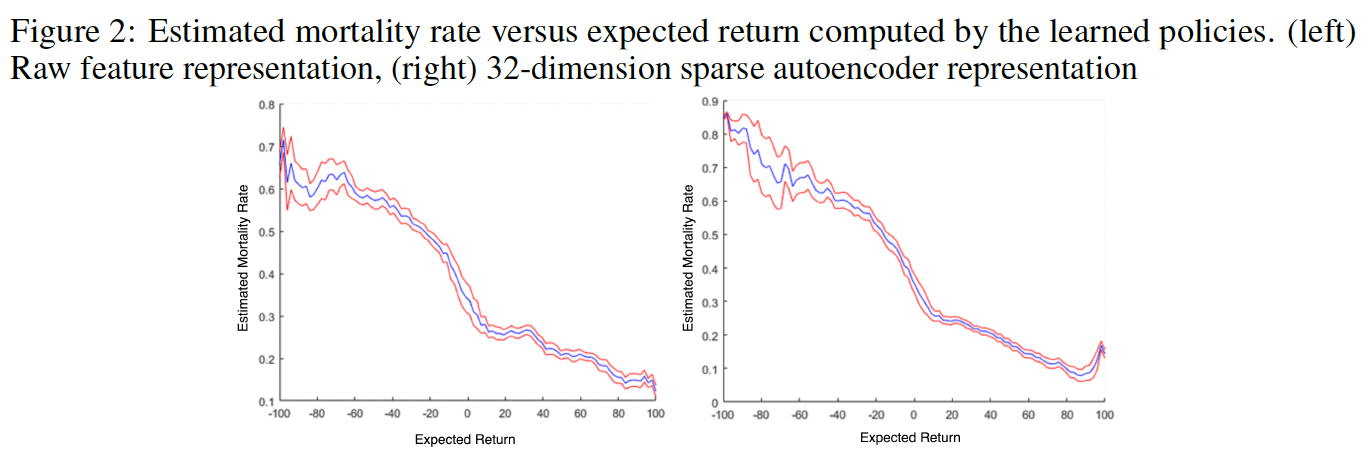
Estimated mortality rate versus expected return computed by the $Q^*$.
How to compare the estimated mortality rate by $\pi^r$ and $\pi^*$?
[Real policy] for testing set, compute mean expected return (Q) -> map to estimated mortality rate
[Optimal policy] for simulated trajectories by $\pi^*$, compute mean expected return (Q) -> map to estimated mortality rate \
Results
The details are skipped.